

This guide is part of our in-depth performance engineering series on WordPress speed optimization. For the complete high-level architecture, start with our foundational 3-step framework.
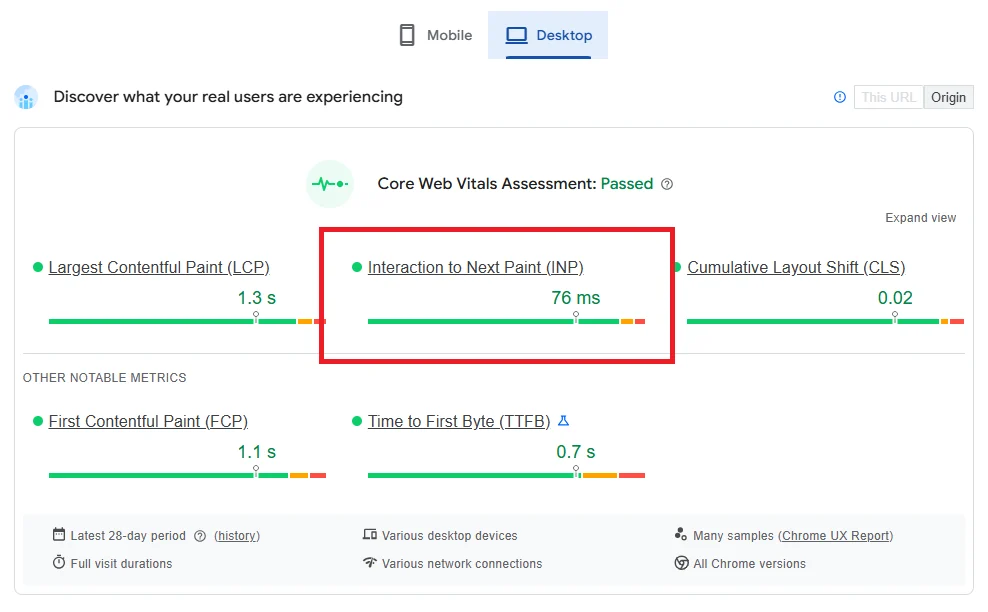
You tap a hamburger menu on your smartphone. Nothing happens. You tap it again. Half a second later, the menu finally stutters open. That frustrating lag is poor responsiveness. And it kills conversions. When visitors feel physical friction on mobile taps, they leave your store. Google knows this. That’s why Interaction to Next Paint replaced First Input Delay as a core ranking signal. Passing this metric requires intentional engineering.
To fix INP WordPress issues below the critical 200-millisecond threshold, you must prevent long JavaScript tasks from monopolizing the browser main execution thread. Interaction to Next Paint (INP) measures the worst-case visual delay across every click, tap, and keyboard interaction throughout a visitor entire session, not just the initial page load. In WordPress environments, sluggish INP is rarely a server capacity failure. Instead, it stems from front-end architectural friction: heavy page builder scripts, un-throttled scroll listeners, bloated WooCommerce AJAX calls, and third-party marketing tags that starve the browser event queue. Resolving INP requires categorizing JavaScript into a 3-way execution model (Defer, Idle, and Interaction Delay), breaking monolithic script blocks with native task-slicing APIs, and protecting transactional checkout flows. When you eliminate main-thread congestion, mobile interactions respond in under 80 milliseconds.
Having studied systems information at university, I’ve spent over a decade diagnosing software performance at the thread and memory level. Across more than 3,000 custom web platforms, high-concurrency Node.js event loops, Laravel enterprise APIs, and WordPress builds engineered at our development company since 2015, event loop starvation is a universal problem. The browser runs on a single thread. When a script hogs that thread for 200 milliseconds, the user clicks are ignored. Let’s look at the underlying mechanics of interaction latency. We’ll turn that sluggish red audit into clean, permanent green.
Table of Contents
1. Google INP Thresholds and CrUX 75th Percentile Evaluation
Google rates page responsiveness using the Chrome User Experience Report (CrUX) measured at the 75th percentile of real-world visits. Testing on your high-end desktop computer tells you almost nothing about how real visitors experience your site. Mid-range mobile processors have significantly slower single-core clock speeds than laptop CPUs. When heavy JavaScript runs on a budget smartphone, tasks take three to five times longer to finish. You can’t rely on lab scores alone. And that’s why field data rules. You can review the official standards directly in the web.dev INP documentation.
Here’s how Google assesses Interaction to Next Paint in field data:
| Performance Rating | Field Threshold (75th Percentile) | User Perception & Conversion Impact |
|---|---|---|
| Good (Passing) | Under 200 ms | Instant visual response. Clicks, taps, and keypresses feel native and immediate. |
| Needs Improvement | 200 ms to 500 ms | Noticeable lag. Mobile menus stutter, and buttons hesitate before showing feedback. |
| Poor (Failing) | Over 500 ms | Severe interface freezing. Users rage-click buttons, triggering duplicate cart orders or bouncing. |
Look at that 75th percentile rule closely. If 74 out of 100 mobile visitors experience snappy 120ms interactions, but the remaining 26 experience a 380ms delay while your product gallery recalculates, your site fails. That’s harsh. No exceptions. But that’s how Google evaluates compliance. In our client audits, we don’t aim for 195ms. That’s cutting it too close. We engineer mobile interactions to paint under 90ms. Every millisecond counts. That cushion guarantees that when real users encounter phone throttling, your site still passes comfortably.
2. Why INP Replaced FID in Core Web Vitals
For years, WordPress developers relied on First Input Delay (FID) to evaluate interaction speed. But FID had massive architectural blind spots. It really did. Over 90% of sites passed FID with flying colors while still feeling painfully slow to use. Google recognized this flaw. So they retired FID permanently in favor of INP.
Why did FID fail to capture real-world user frustration? Two critical reasons:
- FID only checked the first interaction: If a visitor opened your home page and clicked anywhere, FID recorded that first tap and ignored the rest of the visit. It completely missed slow product filters, lagging checkout steps, and sticky mobile navigation.
- FID only measured input delay: FID stopped counting the millisecond your JavaScript event listener started running. If your event handler took 600ms to calculate an order total and another 200ms to paint the update on screen, FID reported zero problem. That was unrealistic.
INP fixes both loopholes. It tracks every click, tap, and keypress across the entire visit. Then it reports the worst-case interaction latency, measuring the full duration until the screen actually updates. You can’t game INP with cheap tricks. You’ve got to fix your JavaScript pipeline. Plain and simple.
3. The 3 Latency Phases of Every User Interaction
To systematically fix INP WordPress bottlenecks, you’ve got to break down what happens between a user physical touch and the screen updating. It isn’t instantaneous. Every interaction moves through three distinct, consecutive stages:
Total INP Latency = Input Delay + Processing Duration + Presentation Delay
(Queued) (Callbacks) (Paint)- 1. Input Delay (Queued Time): The time your click sits in the browser event queue waiting for the main thread to finish running previous tasks. If a heavy script is executing, the browser cannot even start your callback.
- 2. Processing Duration (Callback Execution): The actual CPU time required to run all event listeners attached to the interaction. If your script loops over hundreds of DOM nodes or performs heavy calculations, this phase stretches out.
- 3. Presentation Delay (Layout & Paint): The time the rendering engine needs to recalculate CSS styles, compute layout geometry, and composite pixel buffers onto the physical display. Complex DOM trees make this phase drag.
Notice how these three phases interact. If your Input Delay is 140ms because of an analytics tag, your Processing Duration is 50ms, and your Presentation Delay is 80ms, your total INP is 270ms. That fails Core Web Vitals. But shaving 40ms off any single phase puts you right back in the green. It’s pure math.
4. Profiling Long Tasks (> 50ms) and the Long Animation Frames API
In browser architecture, any JavaScript execution that runs continuously for longer than 50 milliseconds is flagged as a Long Task. Why 50ms? Because to maintain a silky 60 frames-per-second display, the browser must produce a visual frame every 16.6 milliseconds while leaving enough overhead to process user inputs within 100ms. When a script runs for 120ms without yielding, the UI freezes. Dead stop.
To hunt down Long Tasks on your site, open Chrome DevTools and follow this profiling routine:
- Open Performance Panel: Press F12 and switch to the Performance tab.
- Simulate Real Mobile Hardware: Click the gear icon and set CPU to 4x slowdown. This simulates realistic mid-tier mobile phones.
- Record User Actions: Click the Record button, interact with your navigation menu, accordion items, and WooCommerce filters, then stop the recording.
- Inspect the Main Thread Track: Look for gray blocks with red diagonal stripes. Those are your Long Tasks. Click each task to see the exact function name and source file.
Modern browsers now support the Long Animation Frames API (LoAF). Unlike legacy profiling that only shows generic tasks, LoAF exposes the exact script URL, character offset, and execution time directly in the console:
// Observe Long Animation Frames directly in your browser console
const observer = new PerformanceObserver((list) => {
    for (const entry of list.getEntries()) {
        for (const script of entry.scripts) {
            console.warn(`[LoAF Alert] Script: ${script.sourceURL} took ${script.duration.toFixed(1)}ms (Invoker: ${script.invoker})`);
        }
    }
});
observer.observe({ type: 'long-animation-frame', buffered: true });
Run that snippet in your browser console. It’ll instantly list every offending script that delays frame rendering on your site. Quick. Actionable. Zero guesswork.
5. Breaking Long Tasks with scheduler.yield() and Microtask Queuing
When a JavaScript function needs to process a large volume of data (such as filtering 300 WooCommerce products or formatting a table), running everything in one synchronous loop blocks the main thread. The browser can’t render the intermediate visual state or handle queued clicks. Total freeze.
The modern solution is task slicing. By breaking big operations into bite-sized chunks and yielding execution back to the browser event loop, user taps get processed immediately without freezing the UI. That’s where native scheduling shines. The native scheduler.yield() API is designed specifically for this:
// Modern task-yielding utility with legacy fallback
async function yieldToMain() {
    if ('scheduler' in window && 'yield' in scheduler) {
        return await scheduler.yield(); // Native browser task yield
    }
    return new Promise(resolve => setTimeout(resolve, 0)); // Fallback
}

// Example: Processing heavy operations in sliced chunks
async function processItems(items) {
    for (let i = 0; i < items.length; i++) {
        doHeavyWork(items[i]);
        // Yield every 25 items to let the browser paint and accept clicks
        if (i % 25 === 0) {
            await yieldToMain();
        }
    }
}
Look at what happens during that loop: instead of one 250ms blocking block, the browser executes ten 25ms tasks. Between each task, the browser checks its event queue. If the user clicked a button, the browser processes the click and paints the next frame instantly. That keeps your INP score well under 80ms. Dramatic difference.
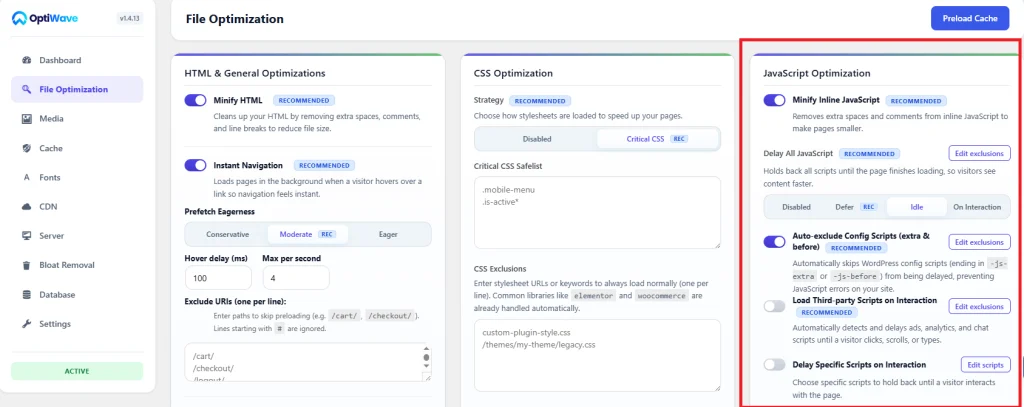
6. 3-Way JavaScript Optimization (Defer vs Idle vs Interaction Delay)
A classic mistake in WordPress speed tuning is applying a blunt delay to all scripts. Don't do it. Blindly holding back every file breaks sliders, disrupts dropdown menus, and prevents form validation. That's terrible for user experience. Proper engineering requires a 3-way script scheduling strategy:
- 1. Defer Tier (Critical UI Scripts): Load core navigation scripts, essential layout helpers, and critical UI interactions with
defer. They download in parallel and execute cleanly at DOMContentLoaded without blocking initial HTML parsing, as covered in our tutorial on eliminating render-blocking resources in WordPress. - 2. Idle Tier (Secondary Scripts): Execute non-critical features (such as social share buttons, related post widgets, or non-essential animations) during browser idle moments using
requestIdleCallback(). - 3. Interaction Delay Tier (Heavy Analytics & Tracking): Completely pause heavy marketing pixels, conversion trackers, and customer chat widgets until the user actually touches the screen, clicks, or scrolls.
When you separate scripts into these three distinct priority tiers, your main thread stays completely clear during the critical first seconds of user interaction. Mobile visitors can tap buttons and browse freely with zero input stutter. Smooth as silk.
7. Neutralizing Third-Party Tracking Scripts and Marketing Pixels
If you audit failing INP scores on commercial WordPress sites, eight out of ten culprits don't come from theme code or core files. They don't. They come from third-party marketing tags: Google Tag Manager containers packed with a dozen trackers, Hotjar session recording scripts, TikTok tracking pixels, and heavy live chat widgets.
Live chat widgets and heatmaps are particularly harmful. They hook into global mousemove, scroll, and click events, running expensive serialization functions on every single touch. That injects 80ms to 200ms of pure Input Delay right when a user tries to interact. It's a huge drag. For complete code pruning techniques, see our guide on removing unused CSS and cleaning WordPress code.
To neutralize third-party script lag:
- Delay Until Real User Touch: Do not load live chat scripts on page boot. Wait for the user first scroll or tap event before injecting the script tag.
- Offload Tags to Web Workers: Run analytics containers inside background Web Workers (using architectures like Partytown) so tracking computations never touch the UI thread.
- Audit Tag Manager Triggers: Replace broad "All Pages" triggers with specific intent triggers (e.g. fire marketing pixels only when someone views a product page or reaches checkout).
8. Fixing Page Builder DOM Bloat and Forced Synchronous Layouts
Many developers focus entirely on JavaScript and forget that your HTML DOM tree directly dictates Presentation Delay. It really does. When a page has an oversized DOM tree (exceeding 1,500 elements or reaching 30 levels deep), recalculating styles after a button click takes substantial CPU time. Page builders like Elementor and Divi frequently generate excessive container nesting that slows down style calculation. Deep nesting hurts.
Even worse is Forced Synchronous Layout (layout thrashing). This happens when JavaScript reads geometric properties from the DOM (like element.offsetWidth or element.getBoundingClientRect()) and then immediately mutates the DOM (like element.style.width = ...) in a rapid loop:
// BAD: Triggers forced synchronous layout on every iteration
for (let i = 0; i < cards.length; i++) {
    const height = cards[i].offsetHeight; // Forces layout recalculation
    cards[i].style.height = (height + 10) + 'px'; // Invalidates layout
}

// GOOD: Batch reads first, then batch writes
const heights = cards.map(c => c.offsetHeight); // Single layout read
cards.forEach((c, i) => {
    c.style.height = (heights[i] + 10) + 'px'; // Batched write
});
Batching your DOM reads and writes prevents the rendering engine from recalculating layout geometry repeatedly during an interaction. And pairing this with proper intrinsic dimensions on all responsive media (as covered in our WordPress image optimization guide) stops layout shifts before they start, as detailed in our guide on fixing Cumulative Layout Shift (CLS) in WordPress. Clean engineering.
9. WooCommerce INP Pitfalls: Cart Fragments and Dynamic Checkout
WooCommerce stores suffer from unique INP vulnerabilities. The most notorious is the legacy cart fragments script (wc-cart-fragments.js). By default, WooCommerce fires an uncached AJAX request to /?wc-ajax=get_refreshed_fragments on every single page view to sync the mini-cart count in your header. It's notoriously sluggish.
When a mobile shopper visits your site on a slow connection, that AJAX call ties up browser memory and triggers extensive main-thread JSON deserialization right when the visitor tries to click a category button or open a filter. Disabling cart fragments on pages without a shopping cart instantly eliminates this bottleneck. Big relief.
// Disable WooCommerce cart fragments on non-shop pages
add_action('wp_enqueue_scripts', function() {
    if (function_exists('is_woocommerce') && !is_woocommerce() && !is_cart() && !is_checkout()) {
        wp_dequeue_script('wc-cart-fragments');
    }
}, 99);
Dynamic checkout pages present another hazard. Address validation, shipping rate calculators, and Stripe payment elements require immediate JavaScript response. If you blindly delay all scripts on checkout endpoints, customers encounter non-responsive input fields and abandon their purchase. Never delay scripts on transactional paths.
10. How to Fix INP in WordPress on Autopilot with OptiWave
Manually rewriting script dependencies, wrapping third-party tags in custom interaction listeners, and auditing handles across dozens of plugins takes hours of developer time. And it's easy to break functionality. Costly mistakes happen fast. That's why we engineered OptiWave: to automate your complete Core Web Vitals optimization in a single engine under 500KB.
Instead of stacking multiple conflicting optimization plugins that slow down your server, OptiWave handles your entire JavaScript optimization workflow seamlessly:
- Intelligent 3-Way Script Scheduling: Automatically categorizes queued scripts into Defer, Idle, and Interaction Delay tiers with granular per-handle exclusion rules.
- WooCommerce Checkout Auto-Bypass: Automatically detects checkout, cart, and account endpoints, bypassing all script delays to guarantee 100% functional payment gateways.
- Third-Party Tag Isolation: Defers heavy tracking pixels and analytics containers until verified user touch, freeing the main thread during navigation.
- Full Core Web Vitals Synergy: Pairs interaction responsiveness with sub-50ms TTFB server rewrites (see our TTFB optimization guide) and automated LCP prioritization (detailed in our LCP optimization guide).
If you're ready to stop losing customers to sluggish mobile taps and pass Google's Interaction to Next Paint benchmark permanently, explore the OptiWave performance plans today and bring your Core Web Vitals comfortably into the green.
What is a good INP score according to Google?
Google rates Interaction to Next Paint (INP) as Good when measured at 200 milliseconds or less for the 75th percentile of recorded page visits in field data. Between 200ms and 500ms Needs Improvement, while anything exceeding 500ms is classified as Poor. In high-performance engineering, our production target for WordPress sites is sub-100ms on 4G mobile devices.
What causes poor INP in WordPress?
Sluggish INP in WordPress is almost always caused by heavy JavaScript tasks exceeding 50ms that block the browser single-threaded main loop. Common culprits include WooCommerce cart fragment AJAX calls (wc-cart-fragments.js), bloated page builder JavaScript, un-throttled scroll listeners, and third-party tracking tags like Google Tag Manager, Hotjar, or Meta Pixel.
How do I test INP locally in Chrome DevTools?
Open Chrome DevTools, select the Performance panel, and enable 4x or 6x CPU slowdown to simulate a mid-range mobile smartphone. Click record and interact with your page: open mobile menus, expand accordion toggles, tap tabs, and click Add to Cart buttons. Stop the recording and inspect the Interactions track to view exact latency breakdowns and culprit scripts.
Will delaying JavaScript break my checkout forms?
Uncontrolled script delay scripts will break payment modals, Stripe inputs, and WooCommerce address validation. Safe optimization suites like OptiWave implement automatic endpoint exclusions for /cart/, /checkout/, and customer portals. This ensures transactional scripts fire immediately while deferring heavy marketing tags on content pages.